The other kinds of profiling
In the previous article I wrote about deterministic profiling in Python and how can the data collected by cProfile be visualised and interpreted by various tools. Continuing the series, I shall present a few other methods of understanding Python code behaviour through third-party tools.
Non-deterministic analysis
One of the most recommended methods that is practiced in the real world is the non-deterministic profiling of code – samples of the call stack which are extracted during code execution without constantly supervising and dissecting frame and code objects. In most cases, this will reveal the troublesome function/code block without intrusive execution overheads.
A similar method is used by plop. This is split into 2 main modules, plop.collector, which can be used as a module inside the target code to switch the profiling process on and off, and plop.viewer, another Tornado-based visualisation tool which can take a profile data file generated with plop.collector and represent it as a graph.
There is a command-line version to start the collector for lazy people like me:
python -m plop.collector script.py
which will put the profiling data into /tmp/plop.out. In order to visualise the data, the Tornado server can be started with
python -m plop.viewer --datadir=/tmp/
Then you must manually open a browser page and go to http://localhost:8888, select the plop.out file and a graph will be drawn on the screen:
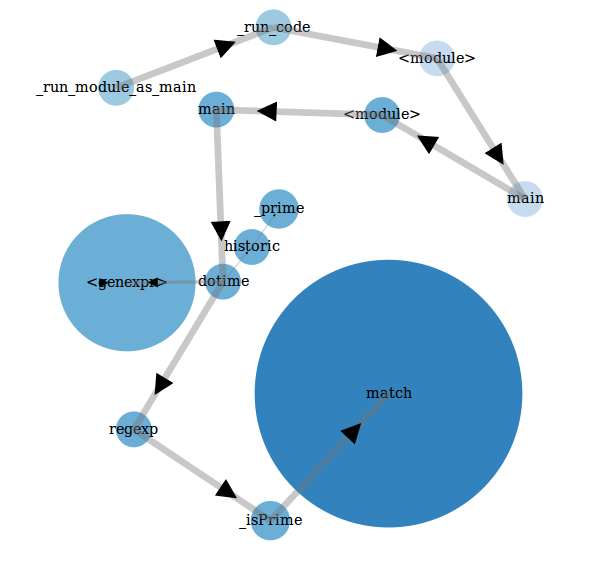
This is by no means the heavy load of information collected by cProfile, but it does capture the essential. The nodes represent different functions that were called while the profiler collected the data, the edges denote which function called which and, most importantly, the size of the nodes represents how much time was spent executing those functions.
Note how the match function is represented through the largest node on the graph because it is the most resource-intensive, while the function naive is not even present in the data collected because it wasn’t high-profile enough to appear on plop’s radar. This is the substance of the non-deterministic approach to profiling: some information about code analysis is lost, but the important bit is preserved with low overhead.
Memory profiling
Until Python 3.4 there was no official module which could offer methods for in-depth memory analysis. However, in Python 3.4 tracemalloc was launched which fills the gap in memory profiling tools and brings some new features in play.
However, until tracemalloc enters the scene, meet
Heapy
This is a memory profiling module which had its last update in 04/2013 and it served its purpose for Python 2.x. If you are stuck with 2.x for some reason and need memory profiling, this is the way to go.
Heapy can be installed through pip2 install guppy. Its documentation is somewhat shady, but there are some tutorials which cover some use cases.
For the purpose of demonstration, I will not show off all the features of heapy, but just a quick’n’dirty command which shows some pretty formatted information:
python2 -c 'hp=__import__("guppy").hpy();h1=hp.heap();__import__("script").main();h=hp.heap()-h1;print h1;print h1.byrcs[0].byid'
This loads the guppy module, retrieves the Use object which can generate some sort of snapshot of the virtual memory, then saves a snapshot, loads our script, executes the main function, then makes the difference between the virtual memory after the script execution and the snapshot took before its launch. And then it prints some stats on the screen with the resulting data.
A bit dizzying, I know (the tutorials I mentioned make a much better job at describing each step of the process), but the relevant bit comes when the information is on screen. The first chunk of data displayed is something like this:
Partition of a set of 25795 objects. Total size = 3307216 bytes.
Index Count % Size % Cumulative % Kind (class / dict of class)
0 11706 45 922704 28 922704 28 str
1 5826 23 468520 14 1391224 42 tuple
2 322 1 276400 8 1667624 50 dict (no owner)
3 67 0 213064 6 1880688 57 dict of module
4 199 1 210856 6 2091544 63 dict of type
5 1630 6 208640 6 2300184 70 types.CodeType
6 1595 6 191400 6 2491584 75 function
7 199 1 177008 5 2668592 81 type
8 124 0 135328 4 2803920 85 dict of class
9 1045 4 83600 3 2887520 87 __builtin__.wrapper_descriptor
As you can see, it shows the types of data that take the most memory space, together with some relevant data, like the total size and the percentage of the memory from the total memory used. Here str is on the first place with 28% of the total memory consumption – the last reaching a whopping 3MB of memory.
The second chunk of data that is presented in the command above is as follows:
Set of 9639 <mixed> objects. Total size = 795912 bytes.
Index Size % Cumulative % Brief
0 3056 0.4 3056 0.4 str: 't\x00\x00|\x...x00|\x02\x00S'
1 2080 0.3 5136 0.6 str: '|\x00\x00j\x...00Wd\x00\x00S'
2 1240 0.2 6376 0.8 str: '|\x02\x00d\x...x00d\x00\x00S'
3 1168 0.1 7544 0.9 str: '|\x01\x00j\x...00<d\x00\x00S'
4 960 0.1 8504 1.1 str: 't\x00\x00|\x...x00f\x02\x00S'
5 864 0.1 9368 1.2 str: 't\x00\x00j\x...03W|\x01\x00S'
6 848 0.1 10216 1.3 str: 't\x00\x00|\x...\x83\x01\x00S'
7 840 0.1 11056 1.4 str: '\x88\x03\x00...01Wd\x00\x00S'
8 824 0.1 11880 1.5 str: 'd\x01\x00d\x...x01|\x01\x00S'
9 728 0.1 12608 1.6 str: 'd\x01\x00d\x...\x03\x00\x16S'
This is much more interesting – it shows the actual objects that take most of the virtual memory consumed in the execution process, with a string representation and their respective size in bytes and percentage. In this case the representation is quite weird, I think, because of the fact that the program actually generates prime numbers as strings.
tracemalloc
This module is distributed together with Python 3.4 and brings some interesting memory analysis features, with easy to follow documentation. Its usage can’t simply be put in a command line, so the one-liner for this demo is, actually, a script compressed into one line of Python:
python -c "tm=__import__('tracemalloc');tm.start(25);h1=tm.take_snapshot();__import__('script').main();print('\n'.join(str(sd) for sd in tm.take_snapshot().compare_to(h1, 'lineno')[:10]))"
But it works and, essentially, this does the same thing as the one-liner for heapy, but displays something a bit different:
<frozen importlib._bootstrap>:321: size=13.1 KiB (+13.1 KiB), count=89 (+89), average=150 B
<frozen importlib._bootstrap>:656: size=3876 B (+3876 B), count=51 (+51), average=76 B
/home/td/Work/ProfilingPython/script.py:5: size=1304 B (+1304 B), count=2 (+2), average=652 B
/home/td/Work/ProfilingPython/script.py:51: size=944 B (+944 B), count=2 (+2), average=472 B
/home/td/Work/ProfilingPython/script.py:29: size=928 B (+928 B), count=2 (+2), average=464 B
/usr/lib/python3.4/sre_parse.py:360: size=776 B (+776 B), count=1 (+1), average=776 B
/usr/lib/python3.4/sre_compile.py:136: size=608 B (+608 B), count=1 (+1), average=608 B
/usr/lib/python3.4/sre_compile.py:76: size=608 B (+608 B), count=1 (+1), average=608 B
/usr/lib/python3.4/sre_parse.py:718: size=576 B (+576 B), count=1 (+1), average=576 B
<frozen importlib._bootstrap>:2214: size=568 B (+568 B), count=1 (+1), average=568 B
The data here contains the top 10 lines of code that consume the most memory when executed: module, line number, how much memory is consumed, along with the difference in value before the line was executed, and how many times it was executed. Very handy for tracing potential memory leaks or memory-intensive code zones.
And that is all
As can be seen from the libraries presented here and in the previous post, there are a multitude of Python tools to choose from for code analysis. However, few of them are improved at a steady pace and the domain of non-deterministic analysis seems to receive less attention than it should.
If you know about other profiling tools or want to express your ideas/solutions concerning this kind of problems, we would love to hear about it!